The table below shows the age of the winners of the Clark County Innovation Award, given annually to a member of the community for the best invention, for the years 1960 through 1989.  Construct a stem-and-leaf plot to display this data.
A) 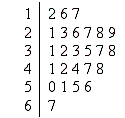
B) 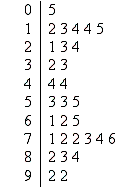
C) 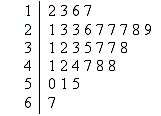
D) 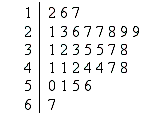
E) 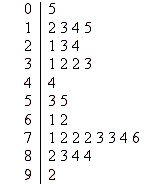
Correct Answer:
Verified
Q5: Wendy took a standardized test that consisted
Q6: Joe has a 2.79 GPA after 39
Q7: Eight health maintenance organizations (HMOs) presented group
Q8: The number of big-screen televisions sold each
Q9: Beatrice has a 2.60 GPA after completing
Q11: The table below shows the immigration rates
Q12: The following table shows the highest education
Q13: The line graph below shows the average
Q14: The following table shows the population of
Q15: A consumer research group purchased identical items
Unlock this Answer For Free Now!
View this answer and more for free by performing one of the following actions

Scan the QR code to install the App and get 2 free unlocks

Unlock quizzes for free by uploading documents