The table below shows the breakdown of International Arms Sales per country for a particular year. 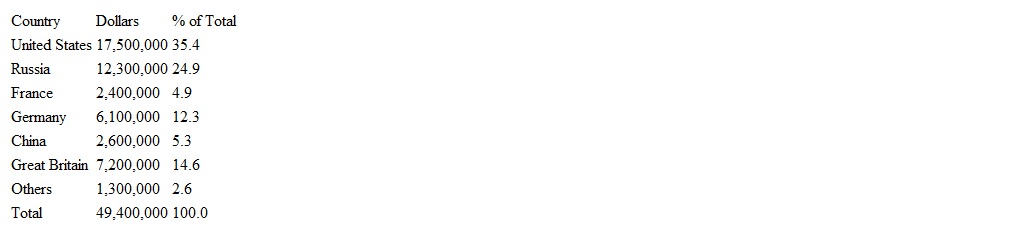 Construct a circle graph using the % of Total data.
A) 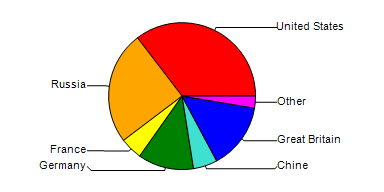
B) 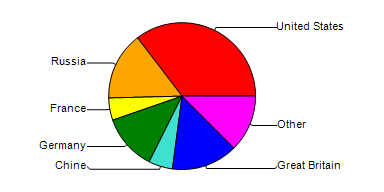
C) 
D) 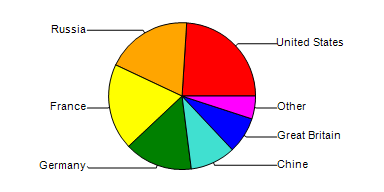
E) 
Correct Answer:
Verified
Q12: The following table shows the highest education
Q13: The line graph below shows the average
Q14: The following table shows the population of
Q15: A consumer research group purchased identical items
Q16: The data below represents the distance, in
Q18: The bar graph below shows the regions
Q19: The line graph below shows the average
Q20: Belinda took three tests. If her median
Q21: How many ways are there to arrange
Q22: On a certain exam, Charles corrected 12
Unlock this Answer For Free Now!
View this answer and more for free by performing one of the following actions

Scan the QR code to install the App and get 2 free unlocks

Unlock quizzes for free by uploading documents