The graph shows the average monthly high temperature in Newark NJ for months from April to September. If a quadratic model  is fit to the graphed data set estimate the coordinates of the vertex.
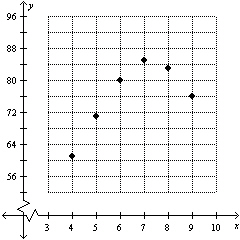
A) 
B) 
C) 
D) 
Correct Answer:
Verified
Q44: The graph shows the average monthly high
Q45: The graph shows the average monthly high
Q46: The average profit in dollars A that
Q47: Given the data set draw a scatterplot.
Q48: The graph shows the average monthly high
Q50: Given the data set draw a scatterplot.
Q51: The graph shows the average monthly high
Q52: You are given a quadratic model
Q53: You are given a quadratic model
Q54: The average profit in dollars A that
Unlock this Answer For Free Now!
View this answer and more for free by performing one of the following actions

Scan the QR code to install the App and get 2 free unlocks

Unlock quizzes for free by uploading documents