Multiple Choice
The graph shows the average monthly high temperature in Newark NJ for months from November to April. If a quadratic model  is fit to the graphed data set will a be positive or negative?
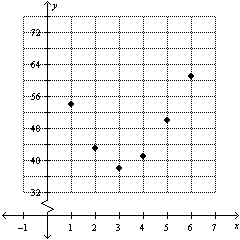
A) positive
B) negative
Correct Answer:
Verified
Related Questions
Q39: Given the data set draw a scatterplot.
Q40: During the years 2002 to 2008 smoking
Q41: The average profit in dollars A that
Unlock this Answer For Free Now!
View this answer and more for free by performing one of the following actions

Scan the QR code to install the App and get 2 free unlocks

Unlock quizzes for free by uploading documents