The graph shows the average monthly high temperature in Newark NJ for months from April to September. If a quadratic model  is fit to the graphed data set will a be positive or negative?
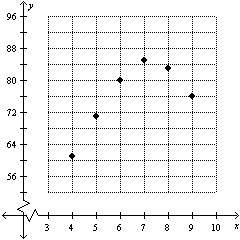
A) positive
B) negative
Correct Answer:
Verified
Q40: During the years 2002 to 2008 smoking
Q41: The average profit in dollars A that
Q42: Given a quadratic model Q43: A quadratic model for the median price Q44: The graph shows the average monthly high Q46: The average profit in dollars A that Q47: Given the data set draw a scatterplot. Q48: The graph shows the average monthly high Q49: The graph shows the average monthly high Q50: Given the data set draw a scatterplot.![]()
Unlock this Answer For Free Now!
View this answer and more for free by performing one of the following actions

Scan the QR code to install the App and get 2 free unlocks

Unlock quizzes for free by uploading documents