A survey of 100 families was taken to find the number of times the families had gone out to eat in the past month. The data are given in the table below. Draw a bar graph for this survey.
A) 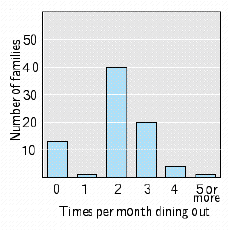
B) 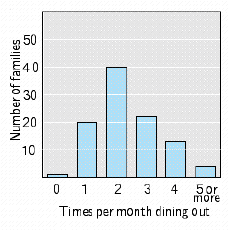
C) 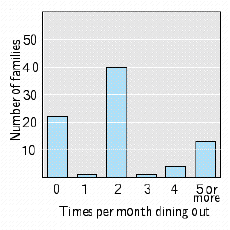
D) 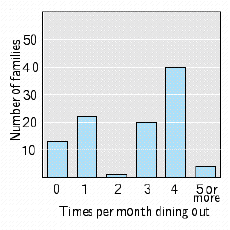
E) 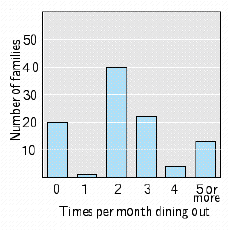
Correct Answer:
Verified
Q161: Consider the following bar graph. How many
Q162: Consider the following bar graph. How many
Q163: Consider the following bar graph. How many
Q164: Consider the following bar graph. How many
Q165: The table below shows the average
Q167: The table below gives the average
Q168: The table below gives the female
Q169: Consider the following bar graph. How many
Q170: Consider the following bar graph. How many
Q171: The table below lists the male
Unlock this Answer For Free Now!
View this answer and more for free by performing one of the following actions

Scan the QR code to install the App and get 2 free unlocks

Unlock quizzes for free by uploading documents