The table below shows the average test scores on chapter tests given in a mathematics class. Draw a bar graph for these scores.
A) 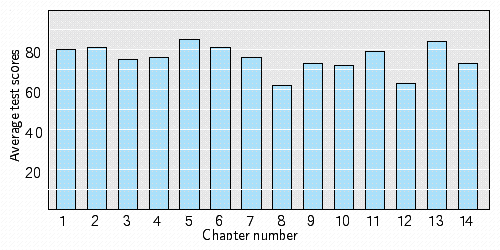
B) 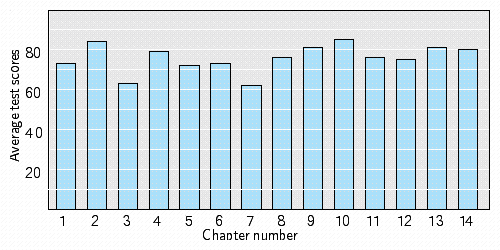
C) 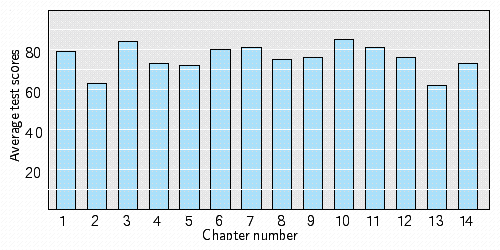
D) 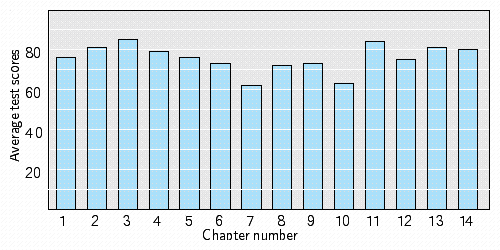
E) 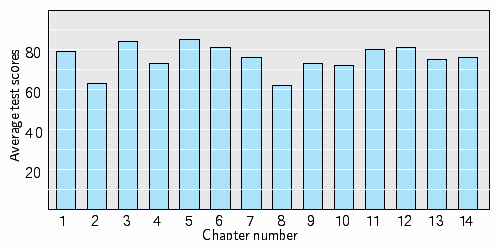
Correct Answer:
Verified
Q160: The sample space is the set
Q161: Consider the following bar graph. How many
Q162: Consider the following bar graph. How many
Q163: Consider the following bar graph. How many
Q164: Consider the following bar graph. How many
Q166: A survey of 100 families was
Q167: The table below gives the average
Q168: The table below gives the female
Q169: Consider the following bar graph. How many
Q170: Consider the following bar graph. How many
Unlock this Answer For Free Now!
View this answer and more for free by performing one of the following actions

Scan the QR code to install the App and get 2 free unlocks

Unlock quizzes for free by uploading documents