The table below lists the male life expectancy for the given countries. Draw a bar graph for these data.
A) 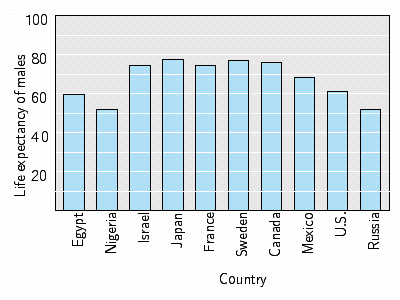
B) 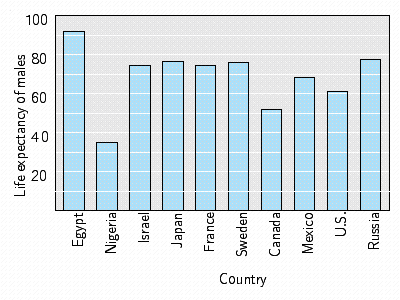
C) 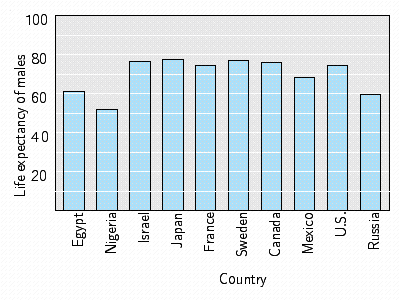
D) 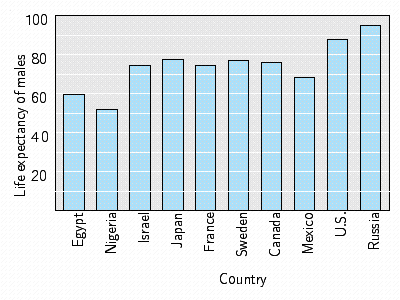
E) 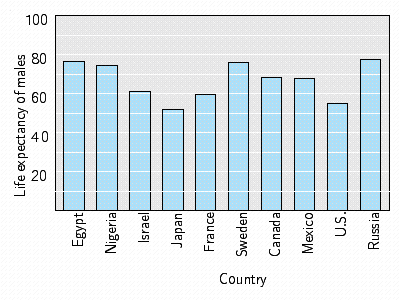
Correct Answer:
Verified
Q166: A survey of 100 families was
Q167: The table below gives the average
Q168: The table below gives the female
Q169: Consider the following bar graph. How many
Q170: Consider the following bar graph. How many
Q172: Consider the following bar graph. What is
Q173: Consider the following bar graph. How many
Q174: Consider the following bar graph. How many
Q175: Consider the following bar graph. How many
Q176: Consider the following bar graph. What country
Unlock this Answer For Free Now!
View this answer and more for free by performing one of the following actions

Scan the QR code to install the App and get 2 free unlocks

Unlock quizzes for free by uploading documents