The Life Expectancy of a Fluorescent Light Bulb Is Given
Question 134
Question 134
Multiple Choice
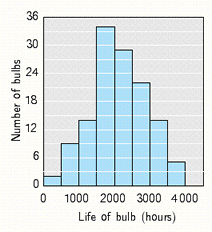
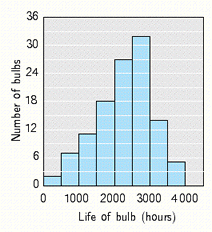
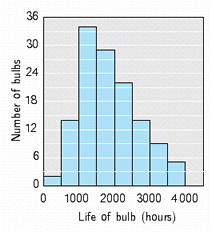
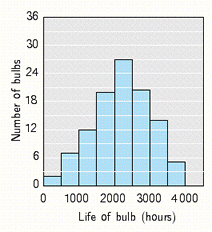
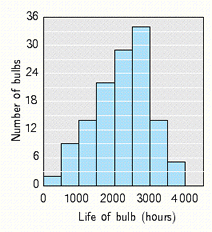
The life expectancy of a fluorescent light bulb is given by the number of hours that it will burn, tabulated in the frequency distribution in the table below. Draw a histogram for the data displayed. Life of bulb (hours) −0.5−499.5499.5−999.5999.5−1,499.51,499.5−1,999.51,999.5−2,499.52,499.5−2,999.52,999.5−3,499.53,499.5−3,999.5 Frequency t2914222934145
A) B) C) D) E)
Correct Answer:
Verified
Unlock this answer now Get Access to more Verified Answers free of charge