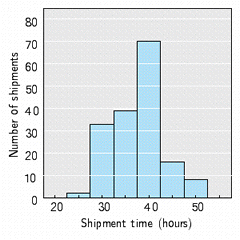
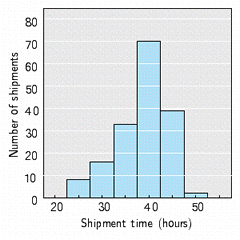
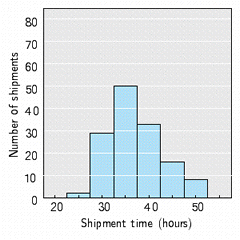
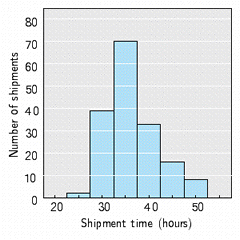
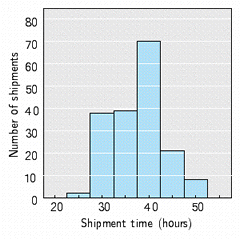
The shipment times in hours for a load of goods from a factory to market are tabulated in the frequency distribution in the table below. Draw a histogram for the data displayed. Life of bulb (hours) −0.5−499.5499.5−999.5999.5−1,499.51,499.5−1,999.51,999.5−2,499.52,499.5−2,999.52,999.5−3,499.53,499.5−3,999.5 Frequency t291422293414b
A) B) C) D) E)
Correct Answer:
Verified
Unlock this answer now Get Access to more Verified Answers free of charge