Multiple Choice
Use the data displayed in the table below to draw a run chart for the daily high temperature in November.
A) 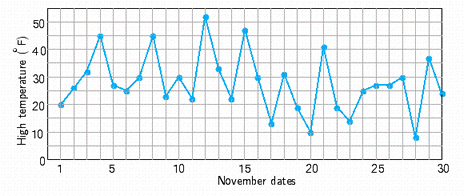
B) 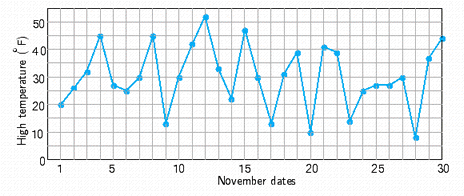
C) 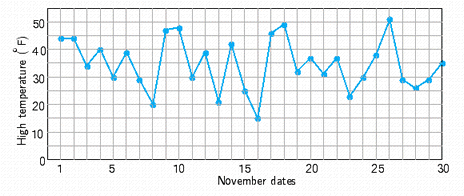
D) 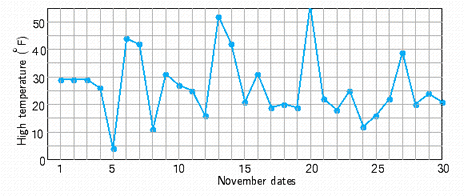
E) 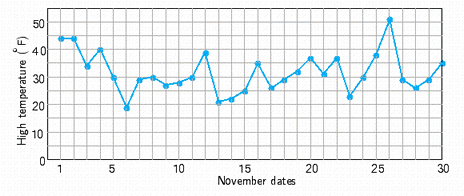
Correct Answer:
Verified
Related Questions
Q125: Mindy's basketball coach kept records on each
Q126: Find the sample space of the black
Q127: Find the sample space of the cards
Q128: x is paired with y by
Q129: The number of passengers and their
Q131: The Precision Manufacturing produces 20,000 machine nuts
Q132: A technician is often asked to
Unlock this Answer For Free Now!
View this answer and more for free by performing one of the following actions

Scan the QR code to install the App and get 2 free unlocks

Unlock quizzes for free by uploading documents