The following graph shows the relationship between a company s profits P and the number of items it sells x . ( P is in dollars.) What is their maximum profit? 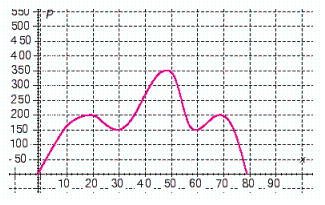 $__________
Correct Answer:
Verified
Q72: The following graph shows the relationship between
Q73: The following graph shows the relationship between
Q74: The following graph shows the relationship between
Q75: For the following relation, give the domain
Q76: State whether the following graph represents a
Q78: Graph the following relation. Use the graph
Q79: Graph the following relation. Use the graph
Q80: Graph the following relation. Use the graph
Q81: Let Q82: Let ![]()
![]()
Unlock this Answer For Free Now!
View this answer and more for free by performing one of the following actions

Scan the QR code to install the App and get 2 free unlocks

Unlock quizzes for free by uploading documents