The following graph shows the relationship between a company s profits P and the number of items it sells x . ( P is in dollars.) How many items must the company sell to make their maximum profit? 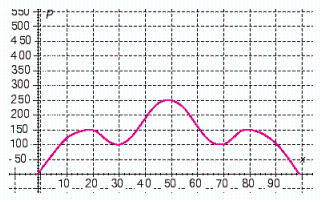
A) The company must sell 20 items to make their maximum profit.
B) The company must sell 50 items to make their maximum profit.
C) The company must sell 80 items to make their maximum profit.
D) The company must sell 100 items to make their maximum profit.
E) The company must sell 70 items to make their maximum profit.
Correct Answer:
Verified
Q67: Does the graph represent a function?
Q68: Suppose you have a job that pays
Q69: The formula for the area 
Q70: A rectangle is 4 inches longer than
Q71: Does the graph represent a function?
Q73: The following graph shows the relationship between
Q74: The following graph shows the relationship between
Q75: For the following relation, give the domain
Q76: State whether the following graph represents a
Q77: The following graph shows the relationship between
Unlock this Answer For Free Now!
View this answer and more for free by performing one of the following actions

Scan the QR code to install the App and get 2 free unlocks

Unlock quizzes for free by uploading documents