The following graph shows the relationship between a company s profits P and the number of items it sells x . ( P is in dollars.)  State the domain and the range of the function.
A) 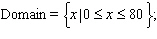
B) 
C) 
D) 

E) 
Correct Answer:
Verified
Q69: The formula for the area 
Q70: A rectangle is 4 inches longer than
Q71: Does the graph represent a function?
Q72: The following graph shows the relationship between
Q73: The following graph shows the relationship between
Q75: For the following relation, give the domain
Q76: State whether the following graph represents a
Q77: The following graph shows the relationship between
Q78: Graph the following relation. Use the graph
Q79: Graph the following relation. Use the graph
Unlock this Answer For Free Now!
View this answer and more for free by performing one of the following actions

Scan the QR code to install the App and get 2 free unlocks

Unlock quizzes for free by uploading documents