Essay
These data represent the number of gas stations along a certain 50-mile length of desert road. Draw
a time series graph for the data. 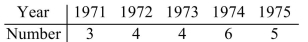
Correct Answer:
Verified
Related Questions
Q43: These data represent the number of stray
Q44: Provided below are the sizes of 15
Q45: These data represent the number of trees
Q46: The frequency distribution below was obtained by
Q47: Find the mean. Q49: Fifty ten-year-olds were monitored to determine the Q50: The exam grades of 31 students were![]()
Unlock this Answer For Free Now!
View this answer and more for free by performing one of the following actions

Scan the QR code to install the App and get 2 free unlocks

Unlock quizzes for free by uploading documents