Essay
These data represent the number of stray cats in a small town for the years listed. Draw a time series
graph for the data. 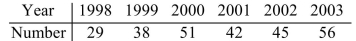
Correct Answer:
Verified
Related Questions
Q38: The grades on a college math exam
Q39: The exam grades of 31 students were
Q40: The frequency distribution below was obtained by
Q41: Find the median. Q42: Find the midrange. Q44: Provided below are the sizes of 15 Q45: These data represent the number of trees Q46: The frequency distribution below was obtained by Q47: Find the mean. Q48: These data represent the number of gas Unlock this Answer For Free Now! View this answer and more for free by performing one of the following actions Scan the QR code to install the App and get 2 free unlocks Unlock quizzes for free by uploading documents![]()
![]()
![]()

