Essay
The frequency distribution below was obtained by monitoring the number of vacation days per year
taken by twenty-five employees. Construct a histogram and frequency polygon for the data. 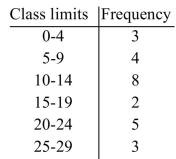
Correct Answer:
Verified
Related Questions
Q35: The following frequency distribution shows for a
Q36: Construct a bar graph for the following
Q37: Construct a pie chart for the number
Q38: The grades on a college math exam
Q39: The exam grades of 31 students were
Unlock this Answer For Free Now!
View this answer and more for free by performing one of the following actions

Scan the QR code to install the App and get 2 free unlocks

Unlock quizzes for free by uploading documents