The frequency distribution below was obtained by monitoring the number of vacation days per year
taken by twenty-five employees. Construct a histogram for the data. 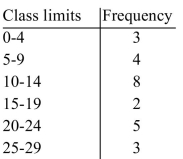
Correct Answer:
Verified
Q48: These data represent the number of gas
Q49: Fifty ten-year-olds were monitored to determine the
Q50: The exam grades of 31 students were
Q51: Find the median. Q52: Provided below are the sizes of 15 Q54: These data represent the number of stray Q55: Fifty ten-year-olds were monitored to determine the Q56: To obtain the frequency distribution below, twenty-three Q57: These data represent the number of students Q58: These data represent the number of students![]()
Unlock this Answer For Free Now!
View this answer and more for free by performing one of the following actions

Scan the QR code to install the App and get 2 free unlocks

Unlock quizzes for free by uploading documents