These data represent the number of students enrolled at a community college. Draw a time series
graph for the data. 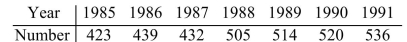
Correct Answer:
Verified
Q53: The frequency distribution below was obtained by
Q54: These data represent the number of stray
Q55: Fifty ten-year-olds were monitored to determine the
Q56: To obtain the frequency distribution below, twenty-three
Q57: These data represent the number of students
Q59: Find the mean. Q60: To obtain the frequency distribution below, twenty-three Q61: The mean, also known as the arithmetic Q62: Find the mode. Q63: Find the range, variance, and standard deviation![]()
![]()
Unlock this Answer For Free Now!
View this answer and more for free by performing one of the following actions

Scan the QR code to install the App and get 2 free unlocks

Unlock quizzes for free by uploading documents