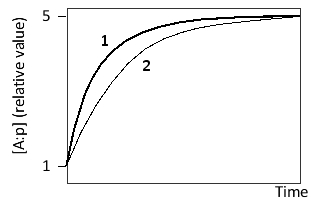
Consider a transcription regulatory protein (A) that can bind to a promoter (p). After reaching an initial steady state, the concentration of A is suddenly increased tenfold. The following graph shows the formation of A:p over time after this change for two systems, one of which is described by higher k?ff and k?n values compared to the other. Which curve (1 or 2) corresponds to this system? Write down 1 or 2 as your answer.

Correct Answer:
Verified
View Answer
Unlock this answer now
Get Access to more Verified Answers free of charge
Q57: The wild-type nematode Caenorhabditis elegans has a
Q58: Indicate whether each of the following descriptions
Q59: There are six possible reading frames for
Q60: The p53 gene is an important tumor
Q61: You have created transgenic mice that carry
Q63: Consider the binding of a transcription regulatory
Q64: Consider a protein composed of only 21
Q65: RNA-seq and ribosome profiling experiments have been
Q66: When a promoter p is not saturated
Q67: You have used a reporter gene system
Unlock this Answer For Free Now!
View this answer and more for free by performing one of the following actions

Scan the QR code to install the App and get 2 free unlocks

Unlock quizzes for free by uploading documents