The eight panels below show average climatic values across the year on a monthly basis, as represented by first letter of each month depicted on the x-axis. Temperature values are depicted as a line graph and represented by the left vertical axis, while precipitation values are depicted as a bar graph and represented by the right vertical axis. 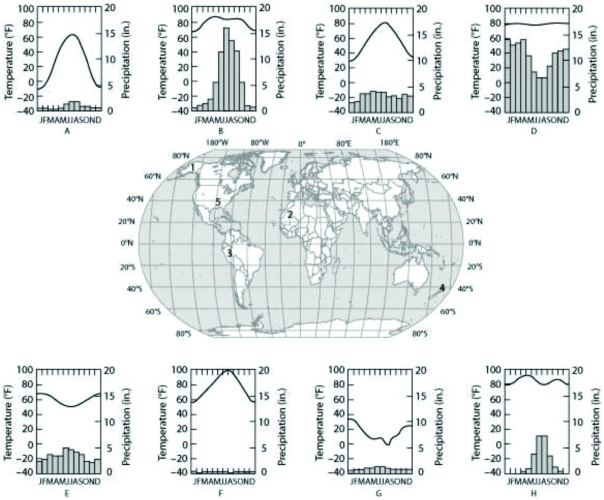 Which panel (A-H) most likely depicts the climate for location 3 as shown on the map in the center panel?
A) B
B) C
C) G
D) D
Correct Answer:
Verified
Q32: The transitions in biological communities with increasing
Q33: Use the following figures to answer the
Q34: Which of the following best explains why
Q35: The eight panels below show average climatic
Q36: Which of the following biomes spans a
Q38: If global warming continues at its present
Q39: In areas of permafrost, stands of black
Q40: Use the following figures to answer the
Q41: Turnover of water in temperate lakes during
Q42: Which aquatic biome listed here is one
Unlock this Answer For Free Now!
View this answer and more for free by performing one of the following actions

Scan the QR code to install the App and get 2 free unlocks

Unlock quizzes for free by uploading documents