Use the following figures to answer the question below. The diagram is a climograph, which depicts the most likely overlap between mean temperatures and precipitation values that result in the given types of biomes. 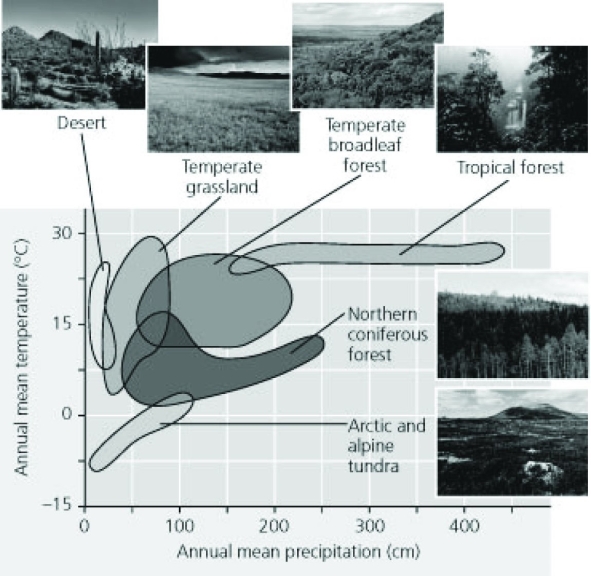 East of the Mississippi River in Hopkinsville, Kentucky, the mean annual precipitation is 130cm. The mean annual temperature is 14.3°C. In the winter, the mean temperature is 7.3°C, while in summer it is 20.6°C. Using the climograph shown here, the biome found in Hopkinsville is most likely a ________.
A) temperate rainforest
B) temperate broadleaf forest
C) shrubland during the winter, temperate forest during the summer
D) temperate forest during the winter, tropical seasonal forest during the summer
Correct Answer:
Verified
Q35: The eight panels below show average climatic
Q36: Which of the following biomes spans a
Q37: The eight panels below show average climatic
Q38: If global warming continues at its present
Q39: In areas of permafrost, stands of black
Q41: Turnover of water in temperate lakes during
Q42: Which aquatic biome listed here is one
Q43: In deep water, which of the following
Q44: Use the following figure to answer the
Q45: Which of the following biomes has the
Unlock this Answer For Free Now!
View this answer and more for free by performing one of the following actions

Scan the QR code to install the App and get 2 free unlocks

Unlock quizzes for free by uploading documents