Use the following figures to answer the question below. The figure depicts average temperatures and total precipitation across the 12 months of the year. Annual precipitation in Area 1 is approximately 260 cm, and in Area 2, 10 cm. 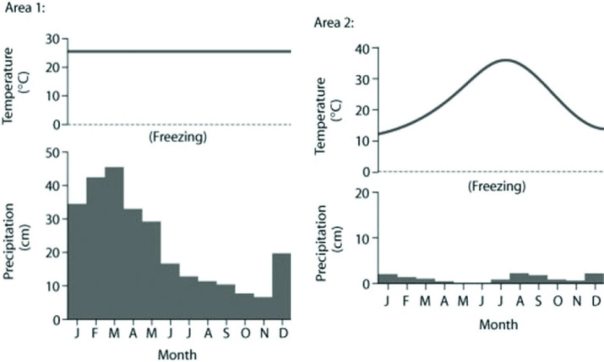 Based on the data in the figures, which of the following statements is most consistent with the data?
A) Area 1 is considered a fall-wet system.
B) Area 1 is near or in the tropics.
C) Area 1 is in mid-continental boreal forest.
D) Area 2 is in the arctic.
Correct Answer:
Verified
Q28: The eight panels below show average climatic
Q29: Which of the following biomes spans the
Q30: Which of the following sources of information
Q31: The eight panels below show average climatic
Q32: The transitions in biological communities with increasing
Q34: Which of the following best explains why
Q35: The eight panels below show average climatic
Q36: Which of the following biomes spans a
Q37: The eight panels below show average climatic
Q38: If global warming continues at its present
Unlock this Answer For Free Now!
View this answer and more for free by performing one of the following actions

Scan the QR code to install the App and get 2 free unlocks

Unlock quizzes for free by uploading documents