Use the graphs to answer the following question. 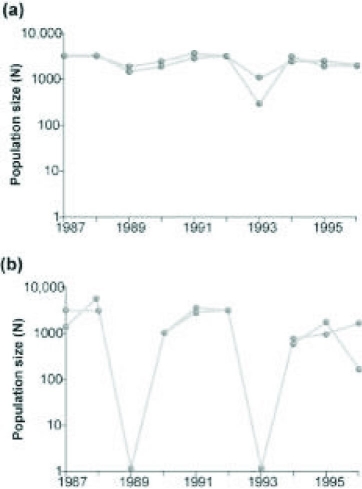 Graph (b) in the figure shows the normal fluctuations of a population of grouse, a ground-nesting bird. Assuming graph (a) in the figure is the result of some experimental treatment in the grouse population, what can be concluded?
A) The experimental treatment intensified the population cycling.
B) The experimental treatment did not affect population cycling in this species.
C) The experimental treatment has most likely identified the cause of population cycling.
D) The experimental treatment involved the introduction of a predator of the bird.
Correct Answer:
Verified
Q43: Use the figure to answer the following
Q44: A population of white-footed mice becomes severely
Q45: Use the graph to answer the following
Q46: Two breeding female fish of the same
Q47: Which of the following graphs illustrates the
Q49: Often the growth cycle of one population
Q50: Use the figure to answer the following
Q51: Use the figures to answer the following
Q52: Use the figure to answer the following
Q53: Which of the following is most consistent
Unlock this Answer For Free Now!
View this answer and more for free by performing one of the following actions

Scan the QR code to install the App and get 2 free unlocks

Unlock quizzes for free by uploading documents