Use the graph to answer the following question. 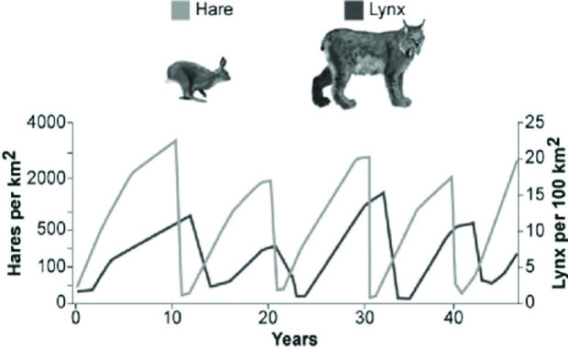 Which hypothesis is most consistent with these data on hare and lynx populations in the graph?
A) Hares decrease in number just before lynx population size begins to increase.
B) Lynx likely control hare population density.
C) Lynx and hare populations are independent of each other.
D) The relationship between the populations cannot be determined only from this graph.
Correct Answer:
Verified
Q40: In 2019, the United States Census Bureau
Q41: Which example best illustrates a semelparous, K-selected
Q42: Which of the following traits is characteristic
Q43: Use the figure to answer the following
Q44: A population of white-footed mice becomes severely
Q46: Two breeding female fish of the same
Q47: Which of the following graphs illustrates the
Q48: Use the graphs to answer the following
Q49: Often the growth cycle of one population
Q50: Use the figure to answer the following
Unlock this Answer For Free Now!
View this answer and more for free by performing one of the following actions

Scan the QR code to install the App and get 2 free unlocks

Unlock quizzes for free by uploading documents