Use the figures to answer the following question. 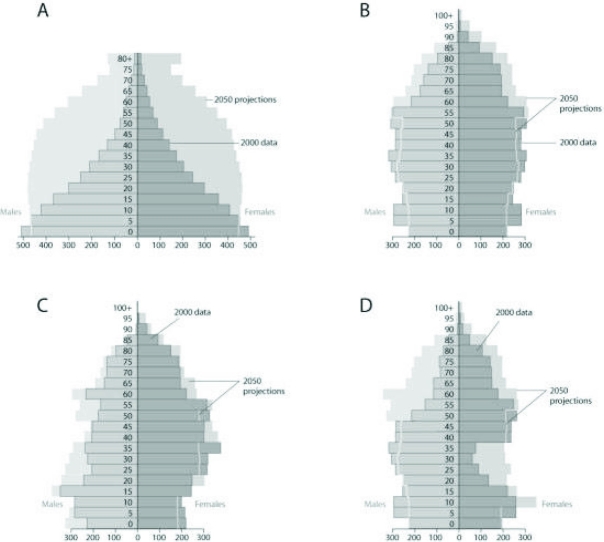 Based on the age-structure diagrams in the figure and on the large population of baby boomers (a demographic cohort born at a reproductive peak after World War II between 1946-1964 in the United States) , which graph best reflects U.S. population in 20 years?
A) A
B) B
C) C
D) D
Correct Answer:
Verified
Q46: Two breeding female fish of the same
Q47: Which of the following graphs illustrates the
Q48: Use the graphs to answer the following
Q49: Often the growth cycle of one population
Q50: Use the figure to answer the following
Q52: Use the figure to answer the following
Q53: Which of the following is most consistent
Q54: Use the graph to answer the following
Q55: Use the graph to answer the following
Q56: Use the graph to answer the following
Unlock this Answer For Free Now!
View this answer and more for free by performing one of the following actions

Scan the QR code to install the App and get 2 free unlocks

Unlock quizzes for free by uploading documents