A normal quartile plot is given below for a sample of scores on an aptitude test. Use the plot to assess the normality of scores on this test. Explain your reasoning. 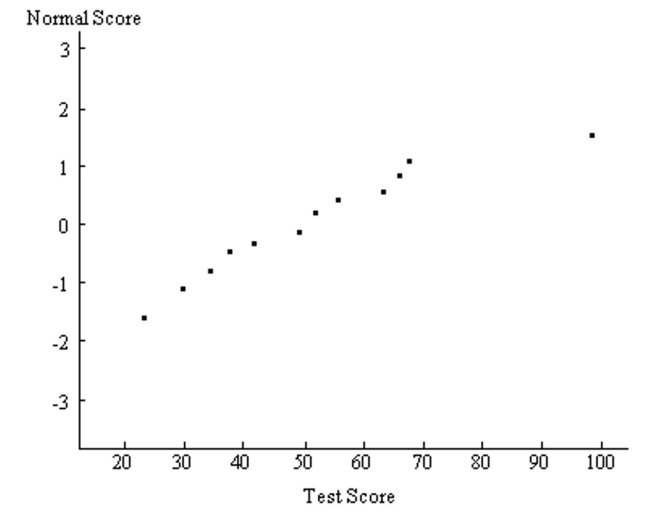
Correct Answer:
Verified
View Answer
Unlock this answer now
Get Access to more Verified Answers free of charge
Q3: Provide an appropriate response.
-Sketch a brief diagram
Q72: Find the indicated z score. The graph
Q74: The volumes of soda in quart soda
Q75: Find the indicated IQ score. The graph
Q78: In one region, the September energy consumption
Q79: The given values are discrete. Use the
Q80: Three randomly selected households are surveyed as
Q81: The Precision Scientific Instrument Company manufactures
Q82: Find the area of the shaded region.
Q168: Solve the problem.
-The ages (in years) of
Unlock this Answer For Free Now!
View this answer and more for free by performing one of the following actions

Scan the QR code to install the App and get 2 free unlocks

Unlock quizzes for free by uploading documents