Find the indicated IQ score. The graph depicts IQ scores of adults, and those scores are normally distributed with a mean of 100 and a standard deviation of 15 (as on the Wechsler test) . 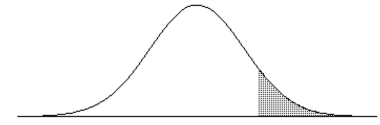 The shaded area under the curve is 0.10.
A) 108.1
B) 100.5
C) 80.8
D) 119.2
Correct Answer:
Verified
Q3: Provide an appropriate response.
-Sketch a brief diagram
Q70: Suppose that replacement times for washing machines
Q71: Human body temperatures are normally distributed with
Q72: Find the indicated z score. The graph
Q74: The volumes of soda in quart soda
Q77: A normal quartile plot is given below
Q78: In one region, the September energy consumption
Q79: The given values are discrete. Use the
Q80: Three randomly selected households are surveyed as
Q168: Solve the problem.
-The ages (in years) of
Unlock this Answer For Free Now!
View this answer and more for free by performing one of the following actions

Scan the QR code to install the App and get 2 free unlocks

Unlock quizzes for free by uploading documents