Find the area of the shaded region. The graph depicts the standard normal distribution with mean 0 and standard deviation 1.
-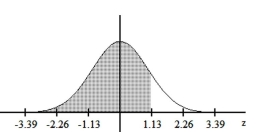
A) 0.8485
B) 0.8708
C) 0.1292
D) 0.8907
Correct Answer:
Verified
Q77: A normal quartile plot is given below
Q78: In one region, the September energy consumption
Q79: The given values are discrete. Use the
Q80: Three randomly selected households are surveyed as
Q81: The Precision Scientific Instrument Company manufactures
Q83: The Precision Scientific Instrument Company manufactures
Q84: Find the indicated z score. The graph
Q85: If z is a standard normal
Q86: Scores on a test have a
Q87: Computers are often used to randomly generate
Unlock this Answer For Free Now!
View this answer and more for free by performing one of the following actions

Scan the QR code to install the App and get 2 free unlocks

Unlock quizzes for free by uploading documents