SCENARIO 19-4 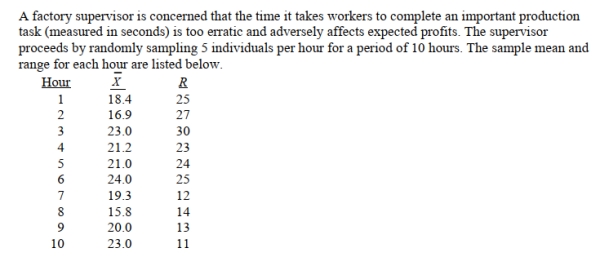 She also decides that lower and upper specification limit for the critical-to-quality variable should be
10 and 30 seconds, respectively.
-Referring to Scenario 19-4, suppose the sample mean and range data were based on 6
Observations per hour instead of 5.How would this change affect the lower and upper control
Limits of an R chart?
A) LCL would increase; UCL would decrease.
B) LCL would remain the same; UCL would decrease.
C) Both LCL and UCL would remain the same.
D) LCL would decrease; UCL would increase.
Correct Answer:
Verified
Q24: True or False: Common causes of variation
Q25: SCENARIO 19-3 Q26: SCENARIO 19-4 Q27: SCENARIO 19-3 Q28: True or False: Common causes of variation Q30: True or False: One of the morals Q31: SCENARIO 19-4 Q32: True or False: The purpose of a Q33: SCENARIO 19-4 Q34: True or False: Special or assignable causes Unlock this Answer For Free Now! View this answer and more for free by performing one of the following actions Scan the QR code to install the App and get 2 free unlocks Unlock quizzes for free by uploading documents![]()
![]()
![]()
![]()
![]()

