SCENARIO 19-3 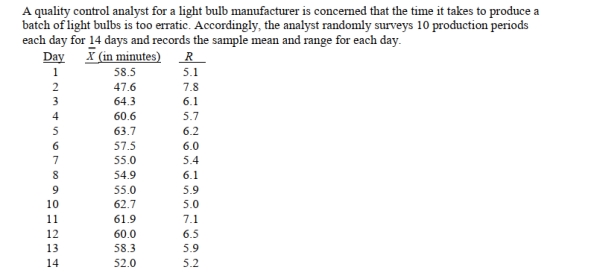
-Referring to Scenario 19-3, suppose the sample mean and range data were based on 11
Observations per day instead of 10.How would this change affect the lower and upper control
Limits of the R chart?
A) LCL would increase; UCL would decrease.
B) LCL would remain the same; UCL would decrease.
C) Both LCL and UCL would remain the same.
D) LCL would decrease; UCL would increase.
Correct Answer:
Verified
Q22: SCENARIO 19-3 Q23: SCENARIO 19-3 Q24: True or False: Common causes of variation Q25: SCENARIO 19-3 Q26: SCENARIO 19-4 Q28: True or False: Common causes of variation Q29: SCENARIO 19-4 Q30: True or False: One of the morals Q31: SCENARIO 19-4 Q32: True or False: The purpose of a Unlock this Answer For Free Now! View this answer and more for free by performing one of the following actions Scan the QR code to install the App and get 2 free unlocks Unlock quizzes for free by uploading documents![]()
![]()
![]()
![]()
![]()
![]()

