Multiple Choice
SCENARIO 19-4 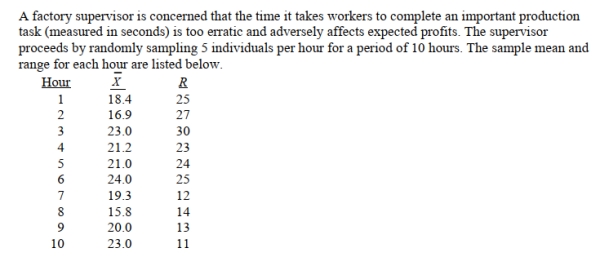 She also decides that lower and upper specification limit for the critical-to-quality variable should be
10 and 30 seconds, respectively.
-Referring to Scenario 19-4, suppose the supervisor constructs an R chart to see if the variability in
Collection times is in-control.This R chart is characterized by which of the following?
A) Decreasing trend
B) Increasing trend
C) In-control
D) Individual outliers
Correct Answer:
Verified
Related Questions

