Provide the appropriate response.
-The following dot plot represents the ages of the customers who visited a sporting goods store on a particular
Monday. 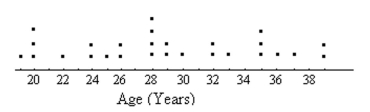
How many people in the sample were aged between 20 and 28, inclusive?
A) 13
B) 10
C) 9
D) 6
Correct Answer:
Verified
Q48: Construct a pie chart representing the
Q49: Construct the requested histogram.
-Lake County wanted
Q50: Construct the requested histogram.
-The following frequency
Q51: Provide the appropriate response.
-A manufacturer records the
Q52: Construct a line chart for the
Q54: Construct the requested histogram.
-The number of
Q55: Provide the appropriate response.
-Attendance records at
Q56: Construct a line chart for the
Q57: Construct a pie chart representing the
Q58: Construct the requested histogram.
-The data below is
Unlock this Answer For Free Now!
View this answer and more for free by performing one of the following actions

Scan the QR code to install the App and get 2 free unlocks

Unlock quizzes for free by uploading documents