Construct a pie chart representing the given data set.
-The data below represent the results of a poll in which the the following question was asked: "To what degree are you
Satisfied with the outcome of the 2006 mayoral election?"

A) 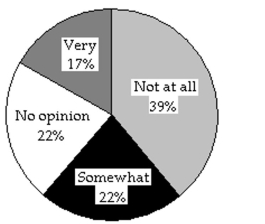
B) 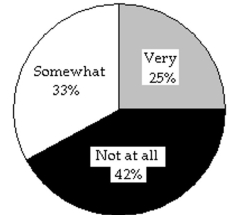
Correct Answer:
Verified
Q52: Construct a line chart for the
Q53: Provide the appropriate response.
-The following dot plot
Q54: Construct the requested histogram.
-The number of
Q55: Provide the appropriate response.
-Attendance records at
Q56: Construct a line chart for the
Q58: Construct the requested histogram.
-The data below is
Q59: Construct a line chart for the
Q60: Construct a pie chart representing the
Q62: Provide an appropriate response.
-Shortly before a
Q115: Provide an appropriate response.
-Construct a frequency table
Unlock this Answer For Free Now!
View this answer and more for free by performing one of the following actions

Scan the QR code to install the App and get 2 free unlocks

Unlock quizzes for free by uploading documents