Construct a pie chart representing the given data set.
-The following figures give the distribution of land (in acres) for a county containing 78,000 acres.

A) 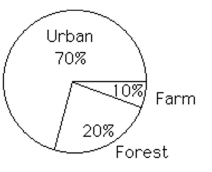
B) 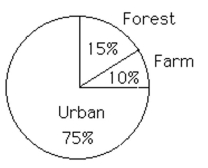
Correct Answer:
Verified
Q55: Provide the appropriate response.
-Attendance records at
Q56: Construct a line chart for the
Q57: Construct a pie chart representing the
Q58: Construct the requested histogram.
-The data below is
Q59: Construct a line chart for the
Q62: Provide an appropriate response.
-Shortly before a
Q63: Solve the problem.
-The following data show
Q64: Solve the problem.
-The weights of 22
Q94: Explain the difference between a frequency distribution
Q115: Provide an appropriate response.
-Construct a frequency table
Unlock this Answer For Free Now!
View this answer and more for free by performing one of the following actions

Scan the QR code to install the App and get 2 free unlocks

Unlock quizzes for free by uploading documents