Construct a pie chart representing the given data set.
-The following data give the distribution of the types of houses in a town containing 34,000 houses.

A) 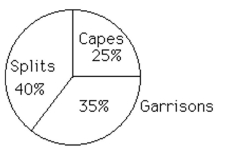
B) 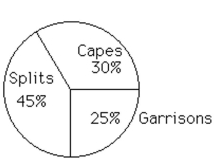
Correct Answer:
Verified
Q43: Construct the requested histogram.
-A medical research
Q44: Construct a pie chart representing the
Q45: Provide the appropriate response.
-The following dot plot
Q46: Construct a line chart for the
Q47: A nurse measured the blood pressure of
Q49: Construct the requested histogram.
-Lake County wanted
Q50: Construct the requested histogram.
-The following frequency
Q51: Provide the appropriate response.
-A manufacturer records the
Q52: Construct a line chart for the
Q53: Provide the appropriate response.
-The following dot plot
Unlock this Answer For Free Now!
View this answer and more for free by performing one of the following actions

Scan the QR code to install the App and get 2 free unlocks

Unlock quizzes for free by uploading documents