Provide the appropriate response.
-The following dot plot represents the ages of the people in a sample selected from a group of campaign
Volunteers. 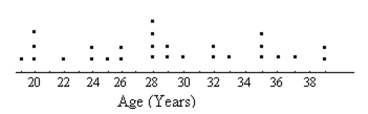
How many people were in the sample?
A) 21
B) 28
C) 30
D) 27
Correct Answer:
Verified
Q40: Make a bar graph to represent
Q41: Construct the requested histogram.
-In a college
Q42: Construct a pie chart representing the
Q43: Construct the requested histogram.
-A medical research
Q44: Construct a pie chart representing the
Q46: Construct a line chart for the
Q47: A nurse measured the blood pressure of
Q48: Construct a pie chart representing the
Q49: Construct the requested histogram.
-Lake County wanted
Q50: Construct the requested histogram.
-The following frequency
Unlock this Answer For Free Now!
View this answer and more for free by performing one of the following actions

Scan the QR code to install the App and get 2 free unlocks

Unlock quizzes for free by uploading documents