Construct a pie chart representing the given data set.
-The data below represent the results of a poll in which the following question was asked: "To what degree are you
Satisfied with your current health insurance?"
Very
Somewhat
Not at All
No opinion 
A) 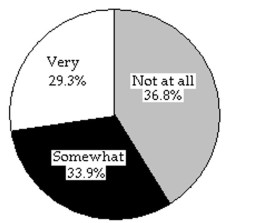
B) 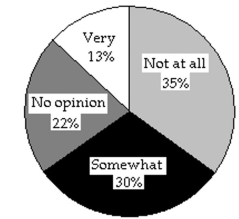
Correct Answer:
Verified
Q37: Make a bar graph to represent
Q38: A nurse measured the blood pressure of
Q39: A nurse measured the blood pressure of
Q40: Make a bar graph to represent
Q41: Construct the requested histogram.
-In a college
Q43: Construct the requested histogram.
-A medical research
Q44: Construct a pie chart representing the
Q45: Provide the appropriate response.
-The following dot plot
Q46: Construct a line chart for the
Q47: A nurse measured the blood pressure of
Unlock this Answer For Free Now!
View this answer and more for free by performing one of the following actions

Scan the QR code to install the App and get 2 free unlocks

Unlock quizzes for free by uploading documents