Identify whether the given scatterplot shows a positive association, negative association, or no association.
-The following scatterplot shows the temperature of a city and the city's latitude.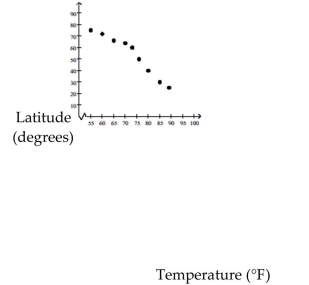
A) negative association
B) no association
C) positive association
Correct Answer:
Verified
Q40: Use the figure to answer the question.
-Students
Q41: Use the figure to answer the
Q42: Identify whether the given scatterplot shows a
Q43: Use the figure to answer the question.
-The
Q44: Use the figure to answer the question.
-The
Q46: Construct the requested statistical display.
-The one-day temperatures
Q47: Use the circle graph to solve the
Q48: Identify whether the given scatterplot shows a
Q49: Identify whether the given scatterplot shows a
Q50: Use the figure to answer the question.
-The
Unlock this Answer For Free Now!
View this answer and more for free by performing one of the following actions

Scan the QR code to install the App and get 2 free unlocks

Unlock quizzes for free by uploading documents