Use the figure to answer the question.
-The sales figures for the Big "D" Company are shown below in a line graph. 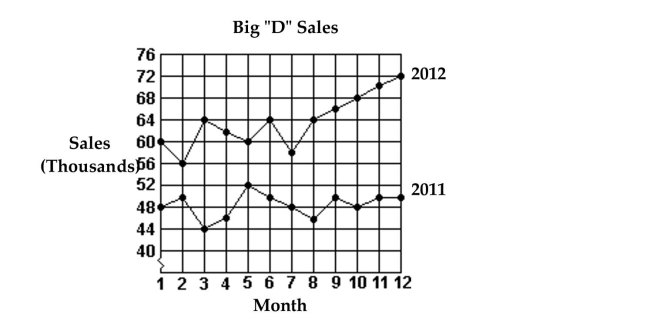 Which month in 2011 had the lowest sales?
A) Month 8
B) Month 2
C) Month 3
D) Month 6
Correct Answer:
Verified
Q38: Use the figure to answer the question.
-The
Q39: Use the figure to answer the question.
-The
Q40: Use the figure to answer the question.
-Students
Q41: Use the figure to answer the
Q42: Identify whether the given scatterplot shows a
Q44: Use the figure to answer the question.
-The
Q45: Identify whether the given scatterplot shows a
Q46: Construct the requested statistical display.
-The one-day temperatures
Q47: Use the circle graph to solve the
Q48: Identify whether the given scatterplot shows a
Unlock this Answer For Free Now!
View this answer and more for free by performing one of the following actions

Scan the QR code to install the App and get 2 free unlocks

Unlock quizzes for free by uploading documents