Use the figure to answer the question.
-Students in Mr. Mason's classes collected items from different countries. The data show how
many of each item one class collected. Construct a bar graph for the frequency data.
Stamps, 9
Postcards, 11
Coins, 7
Books, 13 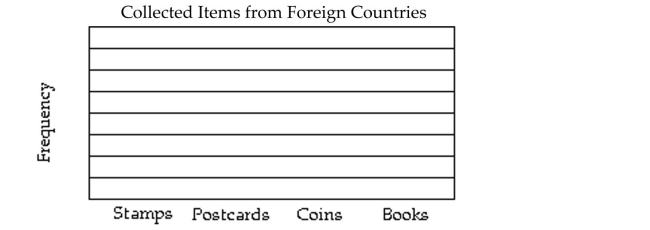
Correct Answer:
Verified
Q35: Construct the requested statistical display.
-The numbers
Q36: Use the figure to answer the question.
-This
Q37: Use the circle graph to solve the
Q38: Use the figure to answer the question.
-The
Q39: Use the figure to answer the question.
-The
Q41: Use the figure to answer the
Q42: Identify whether the given scatterplot shows a
Q43: Use the figure to answer the question.
-The
Q44: Use the figure to answer the question.
-The
Q45: Identify whether the given scatterplot shows a
Unlock this Answer For Free Now!
View this answer and more for free by performing one of the following actions

Scan the QR code to install the App and get 2 free unlocks

Unlock quizzes for free by uploading documents