Use the figure to answer the question.
-This double-bar graph shows the number of male (M) and female (F) athletes at a university over a four-year period. 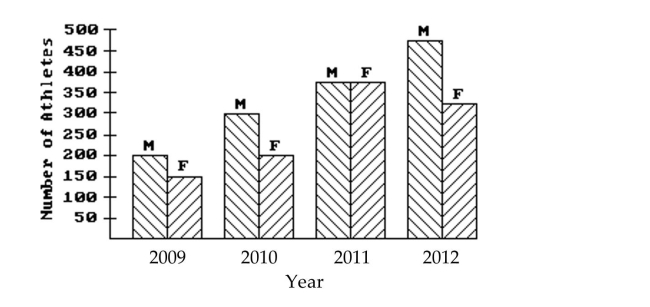 What is the only year in which the number of female athletes declined from its previous value?
A) 2012
B) 2009
C) 2010
D) 2011
Correct Answer:
Verified
Q23: Use the figure to answer the question.
-This
Q24: Use the figure to answer the question.
-The
Q25: Use the figure to answer the question.
-The
Q26: Use the circle graph to solve the
Q27: Use the figure to answer the question.
-The
Q29: Use the figure to answer the question.
-The
Q30: Use the circle graph to solve the
Q31: Use the circle graph to solve the
Q32: Use the figure to answer the question.
-The
Q33: Use the circle graph to solve the
Unlock this Answer For Free Now!
View this answer and more for free by performing one of the following actions

Scan the QR code to install the App and get 2 free unlocks

Unlock quizzes for free by uploading documents