Use the circle graph to solve the problem.
-In a school survey, students showed these preferences for instructional materials. 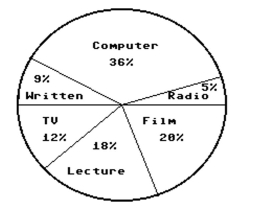 About how many students would you expect to prefer written materials in a school of 450 students?
A) About 81 students
B) About 9 students
C) About 162 students
D) About 41 students
Correct Answer:
Verified
Q26: Use the circle graph to solve the
Q27: Use the figure to answer the question.
-The
Q28: Use the figure to answer the question.
-This
Q29: Use the figure to answer the question.
-The
Q30: Use the circle graph to solve the
Q32: Use the figure to answer the question.
-The
Q33: Use the circle graph to solve the
Q34: Use the figure to answer the question.
-This
Q35: Construct the requested statistical display.
-The numbers
Q36: Use the figure to answer the question.
-This
Unlock this Answer For Free Now!
View this answer and more for free by performing one of the following actions

Scan the QR code to install the App and get 2 free unlocks

Unlock quizzes for free by uploading documents