Use the figure to answer the question.
-This double-bar graph shows the number of male (M) and female (F) athletes at a university over a four-year period. 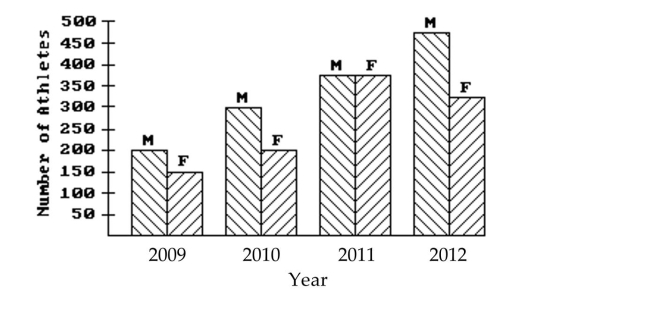 Which year had the greatest number of male athletes?
A) 2011
B) 2012
C) 2009
D) 2010
Correct Answer:
Verified
Q18: Use the figure to answer the question.
-The
Q19: Use the statistical display to answer the
Q20: Use the statistical display to answer the
Q21: Use the circle graph to solve the
Q22: Use the figure to answer the question.
-The
Q24: Use the figure to answer the question.
-The
Q25: Use the figure to answer the question.
-The
Q26: Use the circle graph to solve the
Q27: Use the figure to answer the question.
-The
Q28: Use the figure to answer the question.
-This
Unlock this Answer For Free Now!
View this answer and more for free by performing one of the following actions

Scan the QR code to install the App and get 2 free unlocks

Unlock quizzes for free by uploading documents