The following graph shows the populations of the metropolitan areas of City X and City Y over six years. 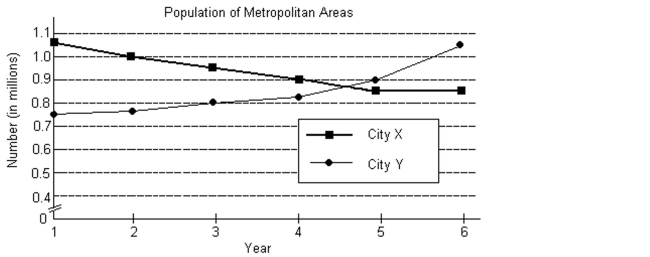
-If equations of the form y f(t) were determined that modeled either of the two graphs, then the variable t would represent _______ and the variable y would represent _______.
A) City Y; City X
B) City X; City Y
C) population (in millions) ; year
D) year; population (in millions)
Correct Answer:
Verified
Q11: Solve the system by substitution.
-2x =
Q12: Solve the system by substitution.
-
Q13: Solve the system by elimination.
-
Q14: Solve the system by substitution.
-
Q15: Solve the system by substitution.
9x +
Q17: Solve the system by elimination.
7x -
Q18: Solve the system by elimination.
Q19: The following graph shows the populations of
Q20: The following graph shows the populations of
Q21: Solve the system.
Unlock this Answer For Free Now!
View this answer and more for free by performing one of the following actions

Scan the QR code to install the App and get 2 free unlocks

Unlock quizzes for free by uploading documents