The following graph shows the populations of the metropolitan areas of City X and City Y over six years. 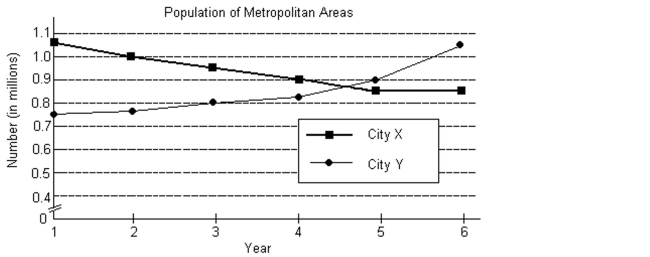
-At the time when the populations of the two metropolitan areas were equal, what was the approximate population of each area?
A) about 0.95 million
B) about 0.92 million
C) about 0.87 million
D) about 1.03 million
Correct Answer:
Verified
Q14: Solve the system by substitution.
-
Q15: Solve the system by substitution.
9x +
Q16: The following graph shows the populations
Q17: Solve the system by elimination.
7x -
Q18: Solve the system by elimination.
Q20: The following graph shows the populations of
Q21: Solve the system. Q22: Solve the system. If the system Q23: Solve the system. Q24: Solve the system. Unlock this Answer For Free Now! View this answer and more for free by performing one of the following actions Scan the QR code to install the App and get 2 free unlocks Unlock quizzes for free by uploading documents

