The following graph shows the populations of the metropolitan areas of City X and City Y over six years. 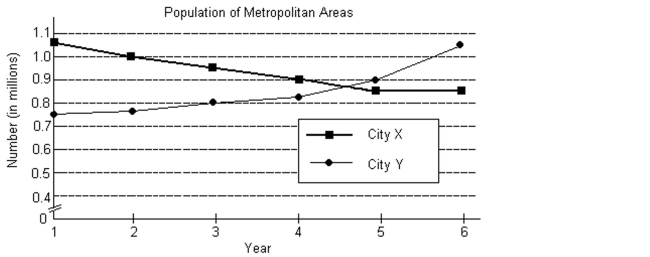
-Use the terms increasing, decreasing, and/or constant to describe the trends for the population of the City X metropolitan area.
A) The population of the City X metropolitan area was increasing from Year 1 to Year 6.
B) The population of the City X metropolitan area was decreasing from Year 1 to Year 5 and was constant from Year 5 to Year 6.
C) The population of the City X metropolitan area was decreasing from Year 1 to Year 6.
D) The population of the City X metropolitan area was increasing from Year 1 to Year 5 and was constant from Year 5 to Year 6.
Correct Answer:
Verified
Q15: Solve the system by substitution.
9x +
Q16: The following graph shows the populations
Q17: Solve the system by elimination.
7x -
Q18: Solve the system by elimination.
Q19: The following graph shows the populations of

