Multiple Choice
Figure 21-9
Graph (a)
Graph (b)
Graph (c) 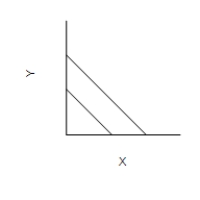
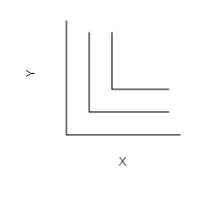
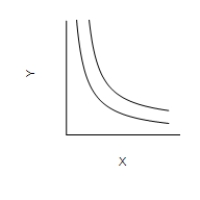
-Refer to Figure 21-9. Which of the graphs illustrates indifference curves for which the marginal rate of substitution varies?
A) Graph (c) only
B) Graph (a) only
C) Graph (b) only
D) All of the graphs show a varying marginal rate of substitution.
Correct Answer:
Verified
Related Questions
Q141: The rate at which a consumer is
Q142: Figure 21-8 Q143: Both Diana and Sarah like Classical music Q144: Alicia is a vegetarian, so she does Q145: Figure 21-7![]()
The following graph shows three possible
Unlock this Answer For Free Now!
View this answer and more for free by performing one of the following actions

Scan the QR code to install the App and get 2 free unlocks

Unlock quizzes for free by uploading documents