Figure 21-7
The following graph shows three possible indifference curves (I) for a consumer. 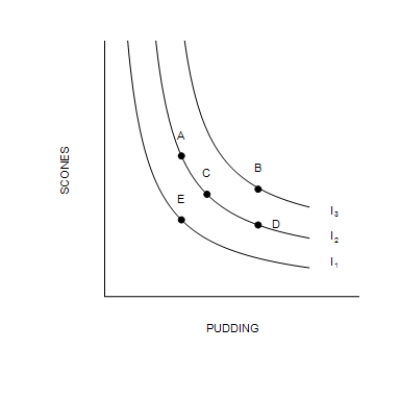
-Refer to Figure 21-7. A person who chooses to consume bundle D is likely to
A) receive higher total satisfaction at bundle D than at bundle A.
B) spend more on bundle D than bundle A.
C) receive higher marginal utility from pudding than from scones.
D) receive higher marginal utility from scones than from pudding.
Correct Answer:
Verified
Q140: Scenario 21-1
Suppose the price of nachos is
Q141: The rate at which a consumer is
Q142: Figure 21-8 Q143: Both Diana and Sarah like Classical music Q144: Alicia is a vegetarian, so she does Q146: Figure 21-9![]()
Graph (a)
Graph (b)
Graph (c) 
Unlock this Answer For Free Now!
View this answer and more for free by performing one of the following actions

Scan the QR code to install the App and get 2 free unlocks

Unlock quizzes for free by uploading documents