Figure 21-7
The following graph shows three possible indifference curves (I) for a consumer. 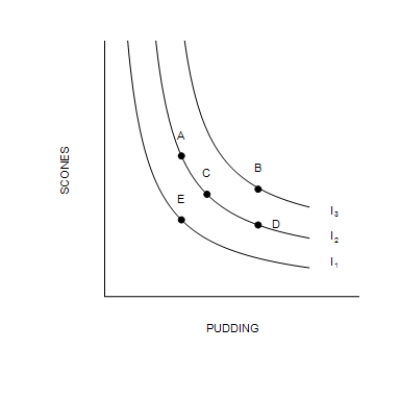
-Refer to Figure 21-7. When comparing bundle A to bundle C, the consumer
A) prefers bundle A because it contains more scones.
B) is indifferent between the two bundles.
C) prefers bundle C because it contains more pudding.
D) In order to compare bundle A to bundle C, we must know the prices of scones and pudding.
Correct Answer:
Verified
Q145: Figure 21-7
The following graph shows three possible
Q146: Figure 21-9
Graph (a)
Graph (b)
Graph (c) 
Q147: Figure 21-8 Q148: Amira prefers apples to oranges. She prefers Q149: Figure 21-7 Q151: Figure 21-7 Q152: Suppose Joshua has budgeted $300 of his Q153: All of the following are properties of Q154: On a graph we draw a consumer's Q155: A family on a trip budgets $800![]()
The following graph shows three possible
The following graph shows three possible
Unlock this Answer For Free Now!
View this answer and more for free by performing one of the following actions

Scan the QR code to install the App and get 2 free unlocks

Unlock quizzes for free by uploading documents